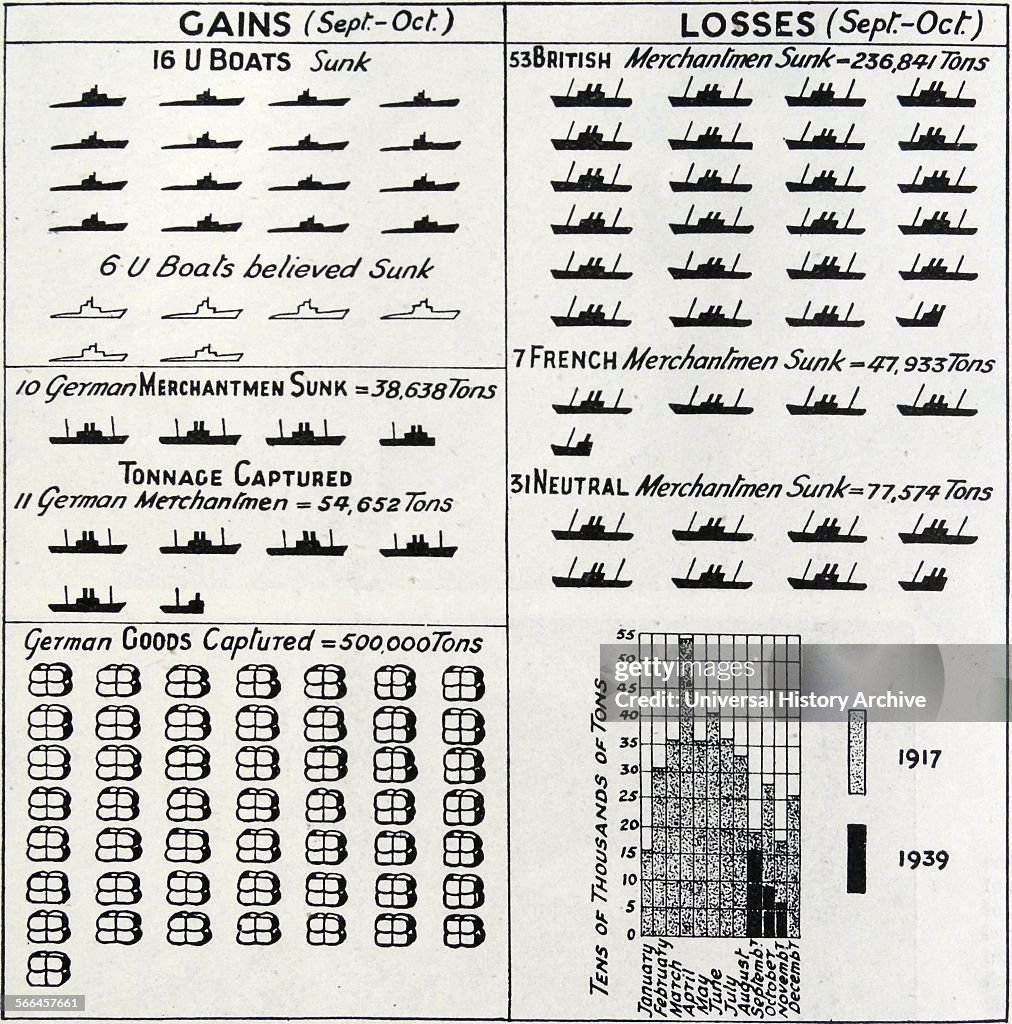
Picture diagram of the Economic War in Germany
Picture diagram of the Economic War in Germany. The diagram shows the result of the first two months of economic warfare at sea. The right-hand bottom corner depicts the amount of British Merchant tonnage sunk during the months of September, October and November during 1939 in comparison to 1917. Dated 1939 (Photo by: Universal History Archive/Universal Images Group via Getty Images)

PURCHASE A LICENSE
How can I use this image?
kr. 3.000,00
DKK
Please note: images depicting historical events may contain themes, or have descriptions, that do not reflect current understanding. They are provided in a historical context. Learn more.
DETAILS
Restrictions:
Contact your local office for all commercial or promotional uses.
Credit:
Editorial #:
566457661
Collection:
Universal Images Group
Date created:
January 01, 1900
Upload date:
License type:
Release info:
Not released. More information
Source:
Universal Images Group Editorial
Object name:
917_05_WHA_057_0667
Max file size:
4552 x 4607 px (15.17 x 15.36 in) - 300 dpi - 3 MB